
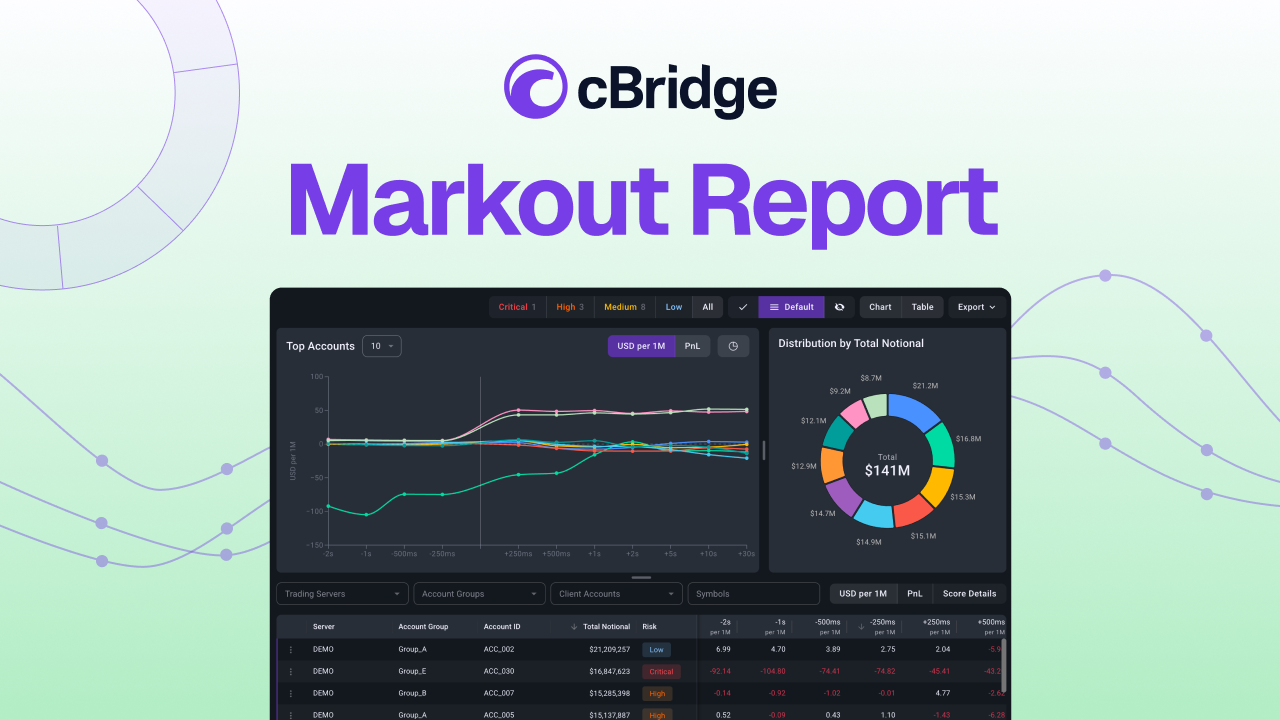
cBridge introduces Markout Report, a risk intelligence layer that helps brokers detect potentially toxic flow, understand its financial impact and respond before losses accumulate.
Many dealing desks already know that a small number of accounts can generate a disproportionate share of B-Book losses. The challenge is identifying those accounts early enough, distinguishing persistent patterns from isolated trades and turning the findings into consistent routing decisions.
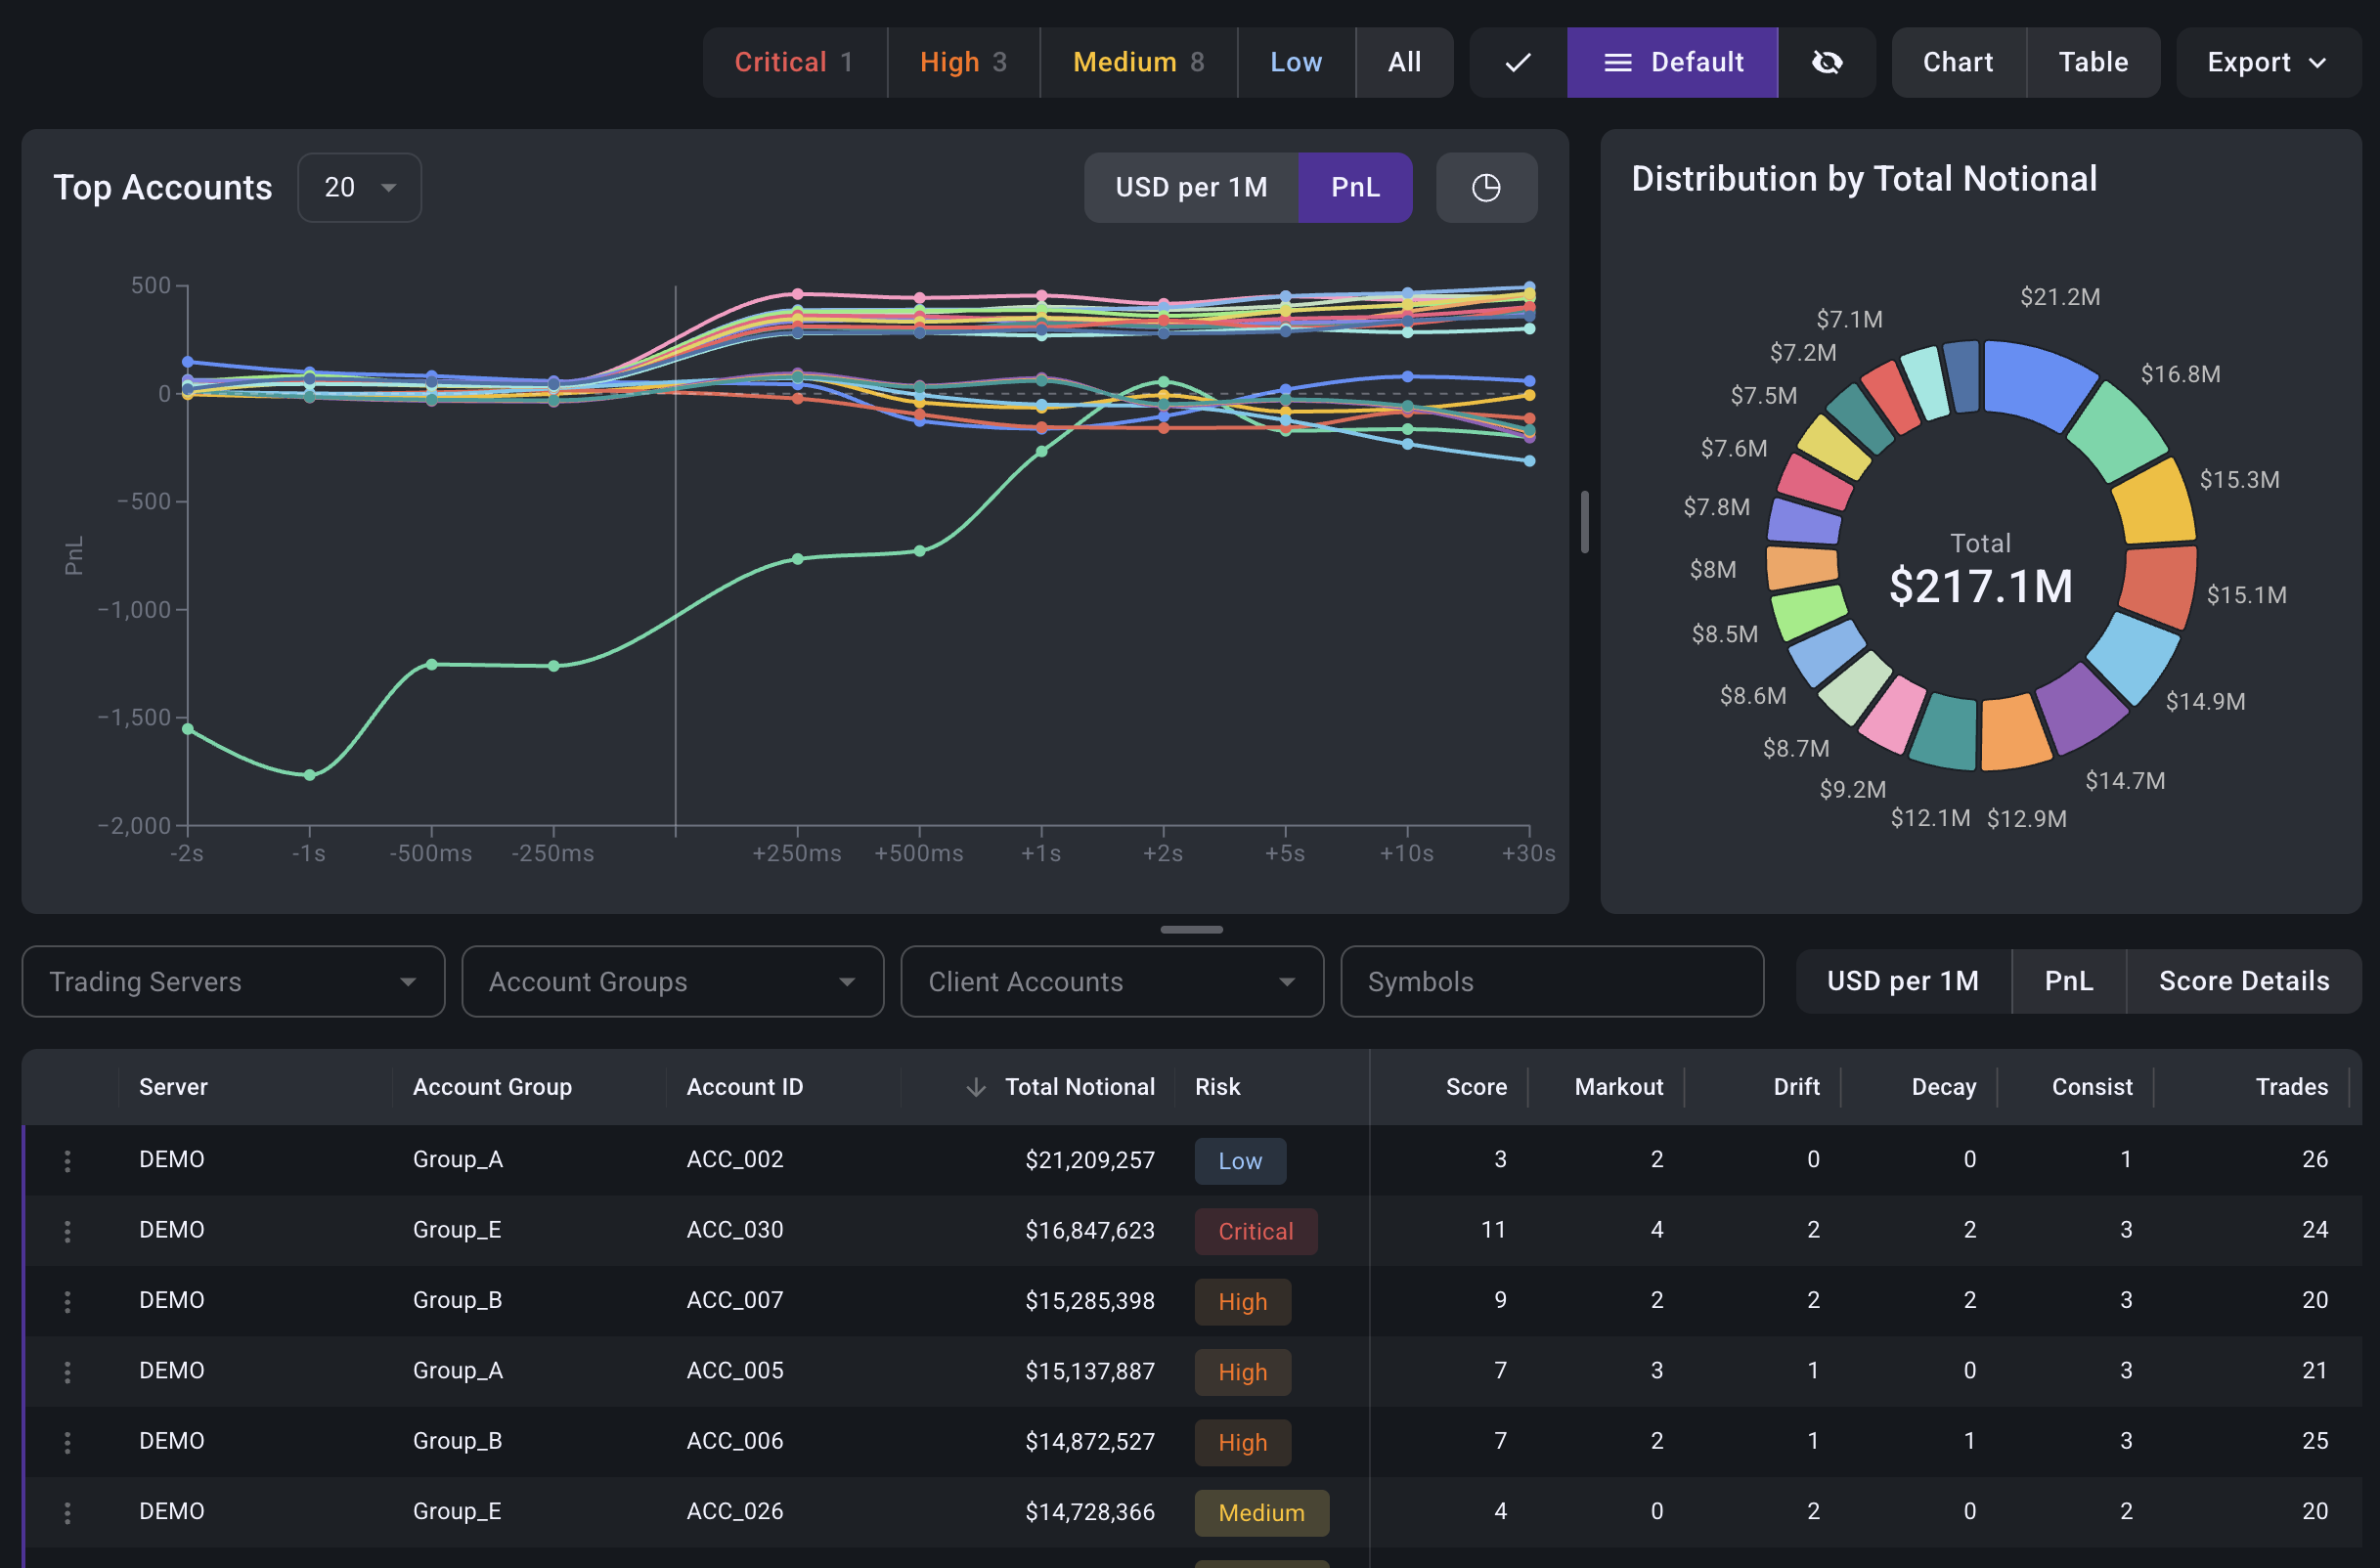
Markout Report addresses this challenge by converting execution records and raw tick data into continuous, account-level risk intelligence. Instead of reviewing disconnected reports after the trading session, brokers can monitor markout and pre-trade drift throughout the day, investigate the accounts with the greatest financial impact and take action within the same cBridge workflow.
Detect risk before it becomes a material loss
Traditional end-of-day analysis shows brokers what has already happened. Markout Report brings the investigation closer to the point when risk develops.
Its intraday dashboard continuously measures markout and pre-trade drift across monitored accounts. This allows dealing and risk teams to identify potentially harmful patterns within the session, including during volatile market conditions, rather than waiting for P&L reconciliation.
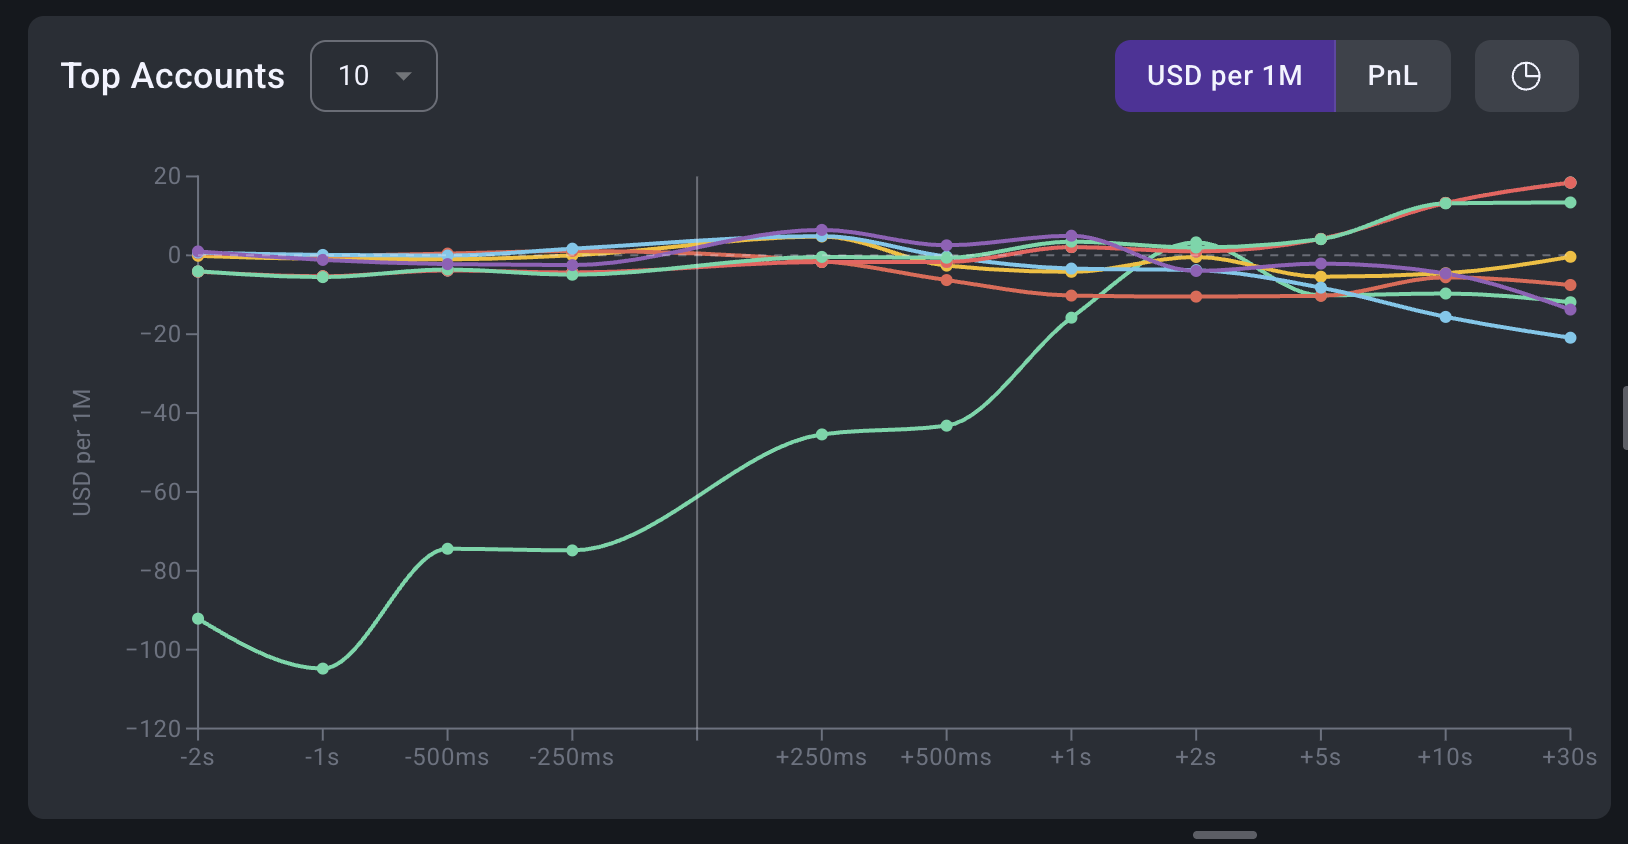
Interactive time-series charts show how price moved before and after execution across configurable intervals. This makes recurring latency patterns, informed trading behaviour and other sources of adverse flow easier to recognise without manually reconstructing trades across spreadsheets and separate systems.
For brokers, the business value is straightforward: earlier visibility gives dealing teams more time to respond before repeated losses accumulate.
Prioritise accounts by financial impact
Not every unusual account requires the same level of attention. A statistically unusual trading pattern may have little commercial impact, while another account can create significant leakage through a relatively small number of high-notional trades.
Markout Report ranks accounts using both risk and notional volume, helping the dealing desk focus on the flow that matters financially.
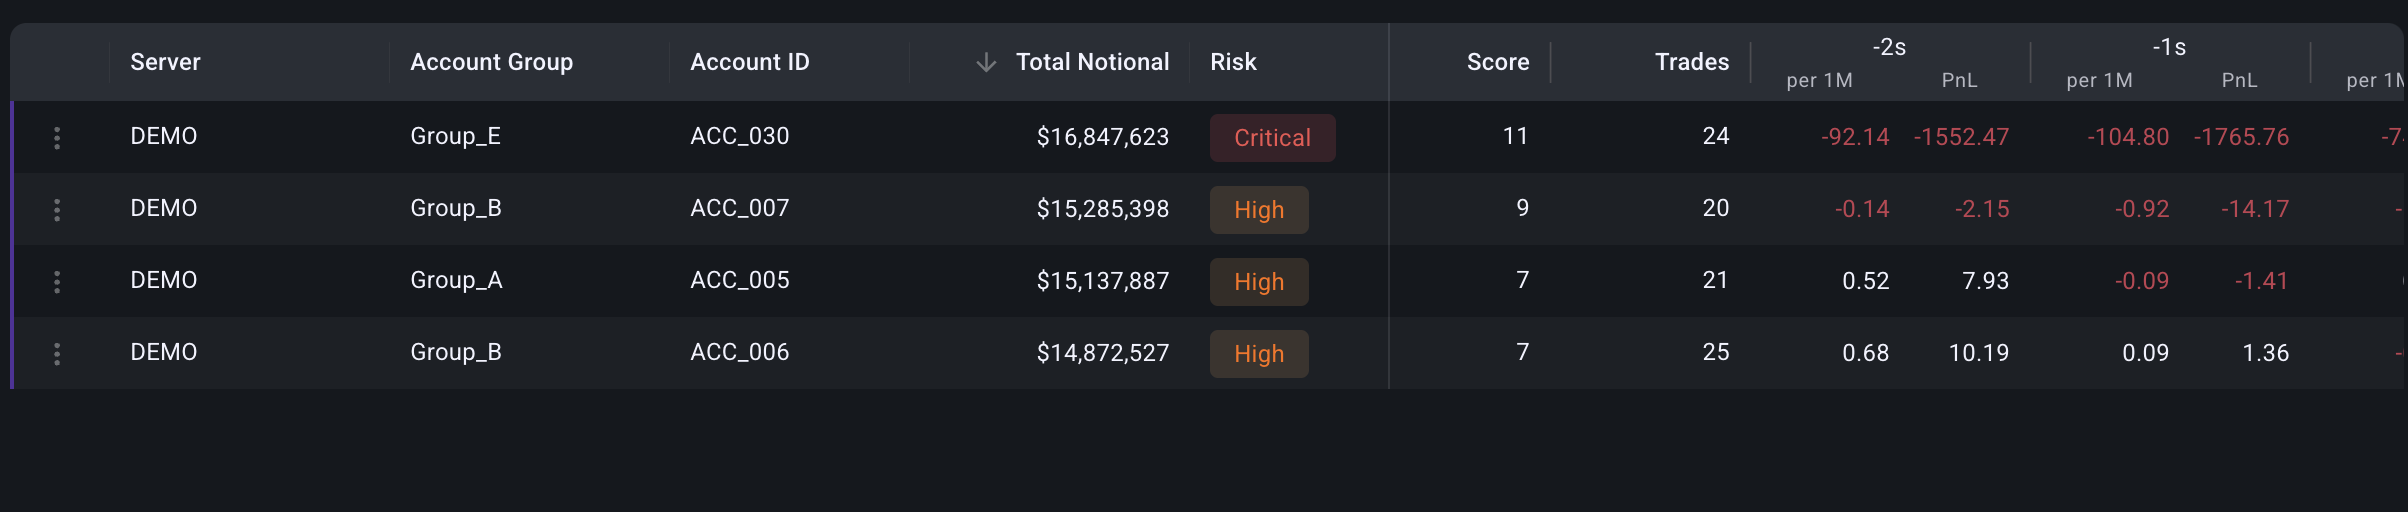
The Top accounts view highlights the highest-impact accounts, while the notional distribution shows how trading volume is concentrated across the account base. Aggregated risk metrics then reveal how much activity falls into each risk category.
Instead of working through long account lists, teams can quickly answer the questions that guide effective risk management:
Which accounts are producing the greatest negative impact? How concentrated is that activity? Where should the dealing desk investigate first?
This reduces time spent on low-value analysis and directs attention towards the accounts where intervention can have the greatest effect on broker P&L.
Replace subjective judgement with explainable risk scores
Markout data becomes useful only when teams can interpret it consistently.
The Markout Report scoring engine converts account behaviour into low, medium, high or critical risk levels. Each score is based on four transparent signal dimensions:
Markout
Pre-trade drift
Decay
Consistency
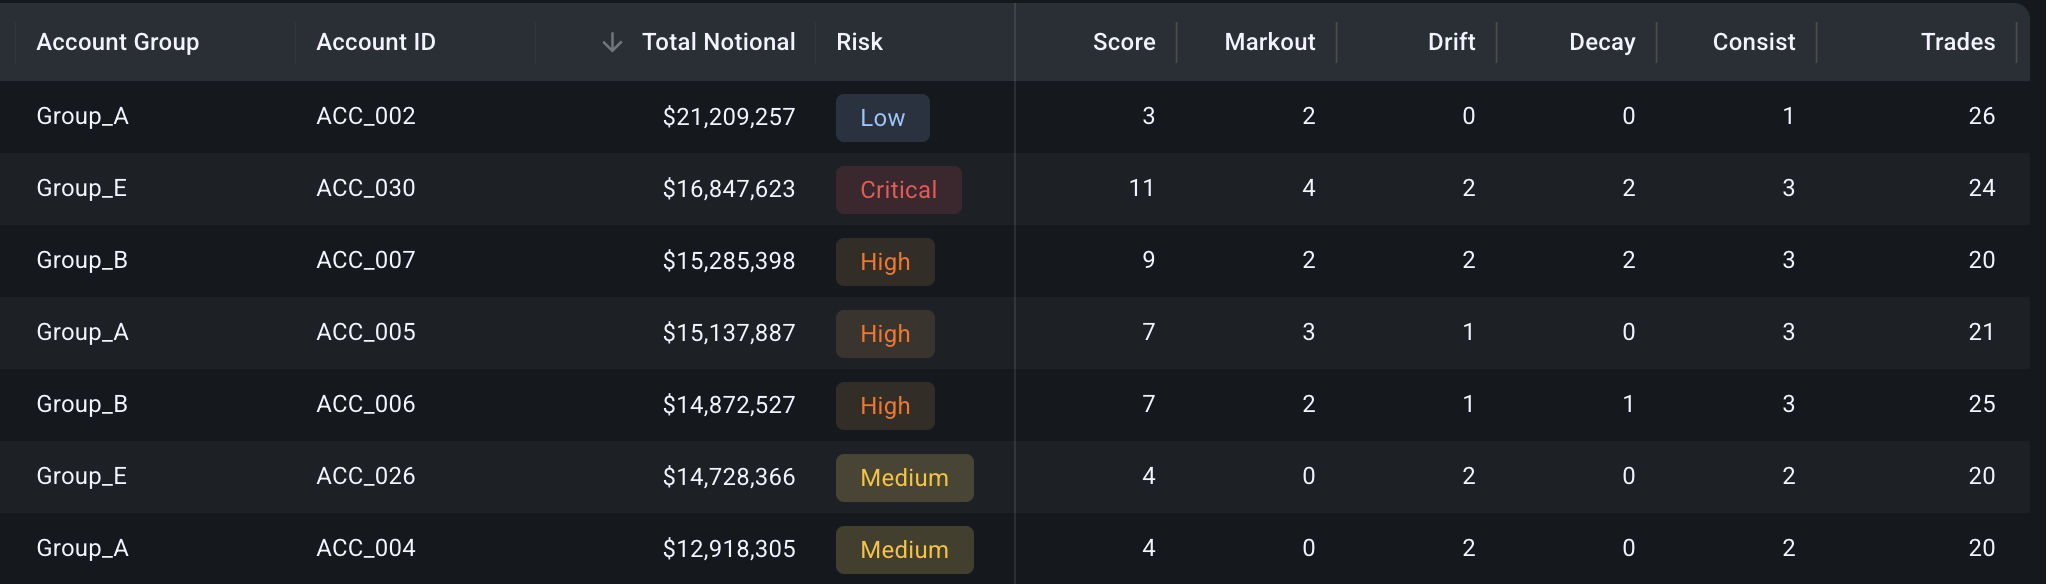
Dealers can see whether the score reflects adverse price movement before execution, persistent post-trade markout, how the effect changes over time or how consistently the pattern appears across trades.
This gives brokers a shared and traceable basis for decision-making. Rather than relying on individual judgement or different interpretations across shifts, teams can apply the same framework to every account.
Clear explanations also make routing decisions easier to review internally. Each action can be linked to measurable execution behaviour, supporting more disciplined risk governance across the dealing desk.
Investigate without rebuilding the analysis manually
Once a potentially harmful account is identified, the next step is usually the most time-consuming: narrowing the analysis by instrument, time period and trading activity to understand what is driving the result.
Markout Report keeps the investigation in one interface.
Scope selection allows teams to focus the analysis on the relevant part of the account base. Advanced filters help isolate specific conditions and iterate quickly, while drill-down capabilities reveal whether the behaviour is concentrated in a particular instrument or repeated across several markets.
Accounts can also be categorised to support a structured investigation process and pinned to keep high-priority entities visible throughout the review.
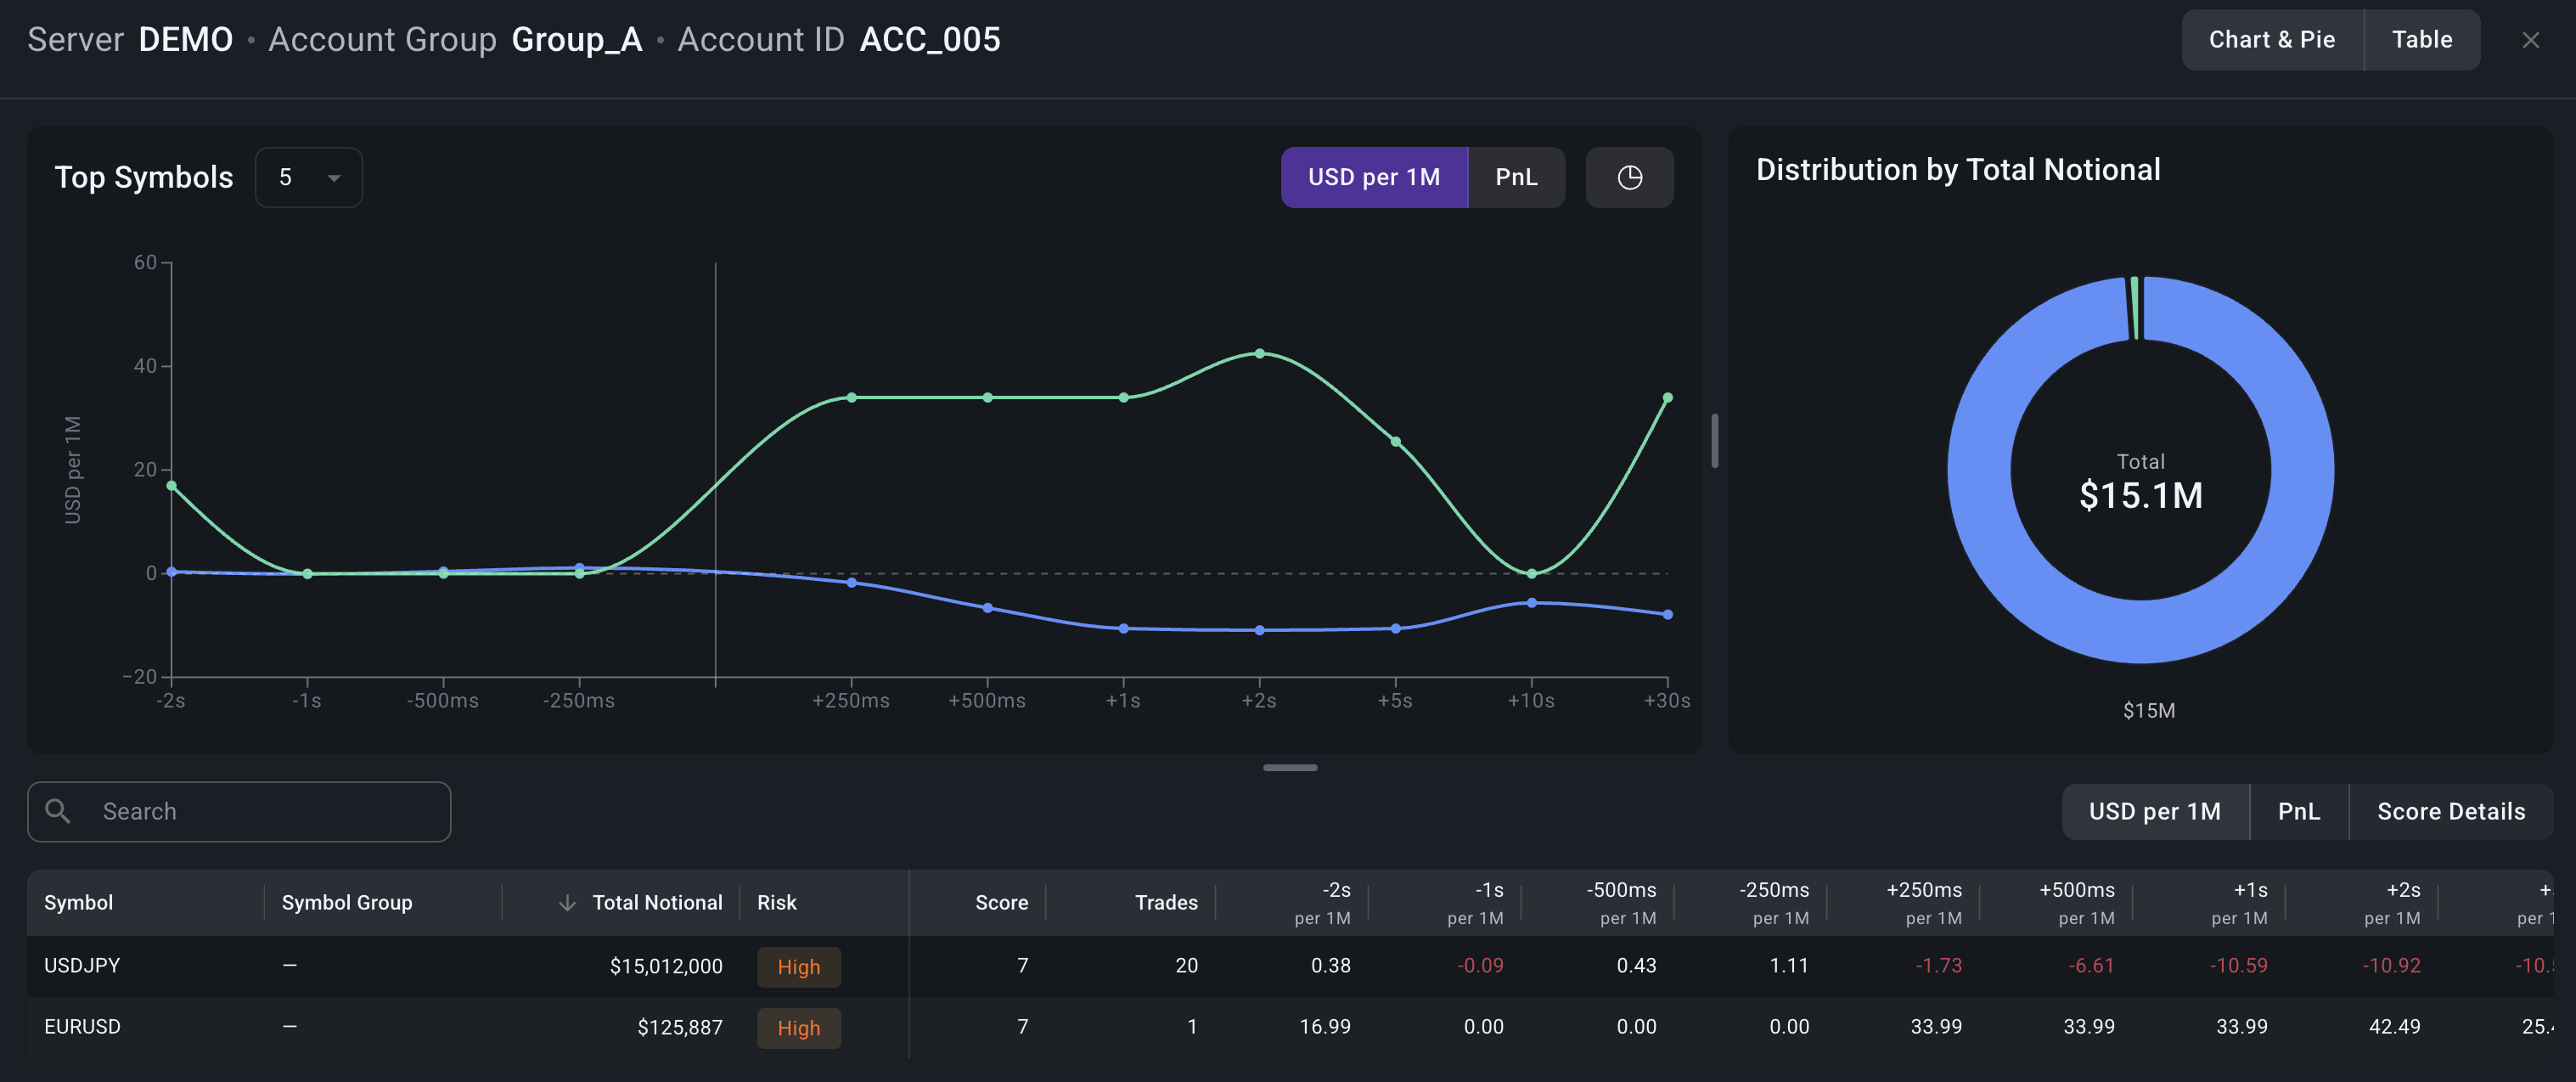
By combining charts, account tables, risk summaries and investigation tools in one workspace, cBridge removes much of the manual work required to move from a broad warning signal to a clear account-level conclusion.
Move directly from insight to routing action
A risk report has limited value when the resulting action must be completed in another system.
Markout Report connects detection, explanation and investigation with cBridge routing controls. Once the dealing desk confirms that an account requires intervention, the relevant routing action can be initiated within the same environment.
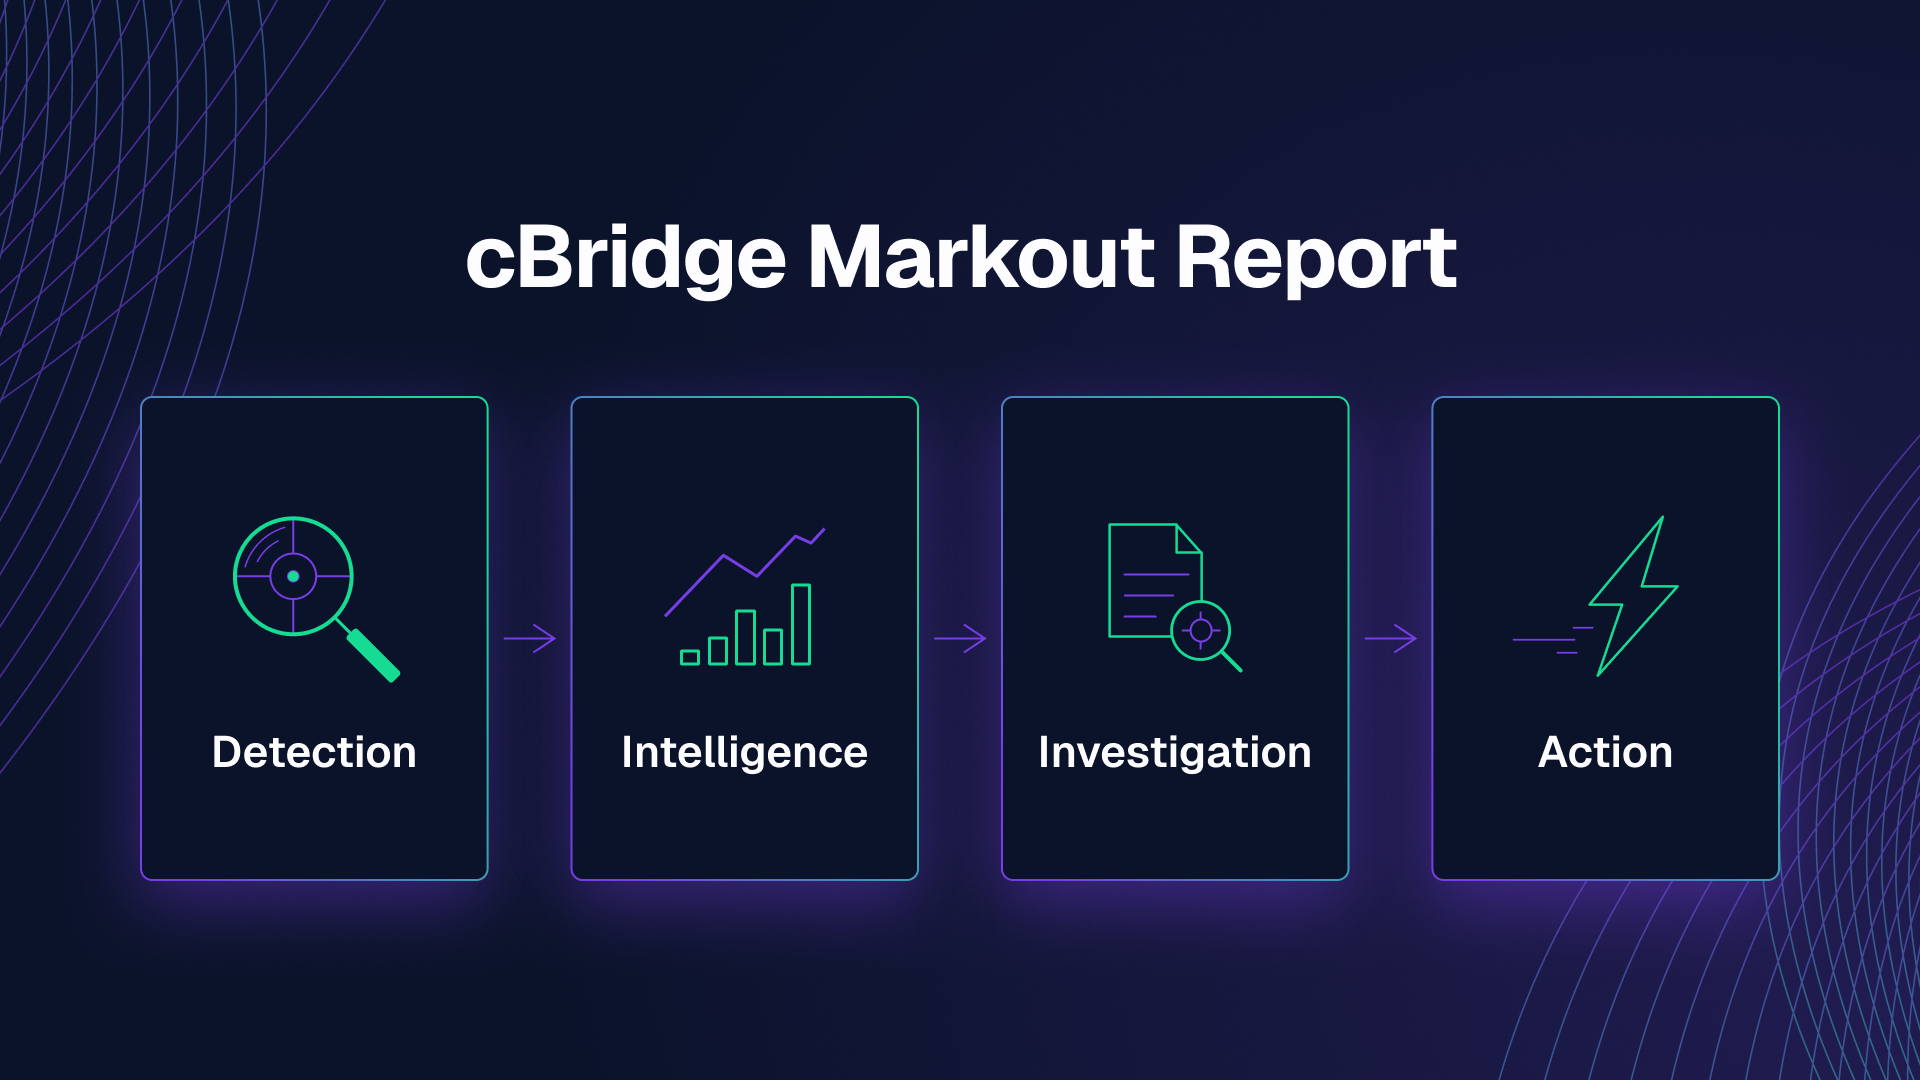
This creates a complete decision loop:
Detection: Intraday markout and drift metrics surface high and critical accounts.
Intelligence: The scoring engine shows which signals caused the account to be flagged.
Investigation: The team investigates the account, instruments and behaviour in greater detail and can export the results for further review.
Action: Routing controls allow the broker to apply the appropriate routing treatment without transferring account IDs between disconnected tools.
Keeping the full workflow together reduces response time and lowers the operational risk created by copy-pasting data, switching between platforms and relying on informal handovers.
Protect P&L with a more focused dealing workflow
For dealing teams, the value of Markout Report is not simply access to another dataset. It is the ability to make faster and more consistent decisions using measurable evidence.
Brokers can identify adverse flow earlier in the session, isolate the small group of accounts responsible for outsized losses and understand why each account has been classified as risky. They can then move from analysis to routing action without leaving cBridge.
The result is a more focused dealing operation, less time spent reconstructing execution behaviour and stronger control over B-Book performance.
Markout Report supports the broader cBridge goal of making risk management a core function of the liquidity bridge. Rather than operating only as a connection between trading platforms and liquidity providers, cBridge brings execution monitoring, investigation and control into one operational environment.
Turn execution data into a business decision
Every broker already generates the execution data needed to understand its flow. The difference lies in how quickly that data becomes actionable.
With continuous markout measurement, account views prioritised by financial impact, explainable risk scoring and integrated routing actions, Markout Report helps brokers move from delayed analysis to measurable control.
Markout Report is available as part of cBridge for qualified brokers.
Request a demo to see how your execution data can be analysed within cBridge and discuss how Markout Report can support your B-Book risk workflow.
Keep reading
Best liquidity bridge providers for brokers in 2027: a practical comparison
Comparing liquidity bridge providers? See how cBridge, oneZero, PrimeXM, FXCubic, Centroid Solutions and Tools for Brokers stack up against the same public criteria.
 cBridge team
What is a liquidity bridge? A practical guide for FX and CFD brokers
Learn what a liquidity bridge does, how it connects trading platforms to liquidity providers, and how brokers use it for pricing, routing and execution.
cBridge team
How to switch liquidity bridge provider without disrupting trading
Thinking about switching liquidity bridge providers? A practical framework for migrating safely, using parallel deployment, configuration mapping and phased cutover.
cBridge team