

Most FX and CFD brokers treat the bridge bill as a cost that rises with the business. Trade more, pay more. Even when it climbs higher than it should, switching a bridge provider feels like more hassle than it is worth, so they stay and keep paying.
The setup
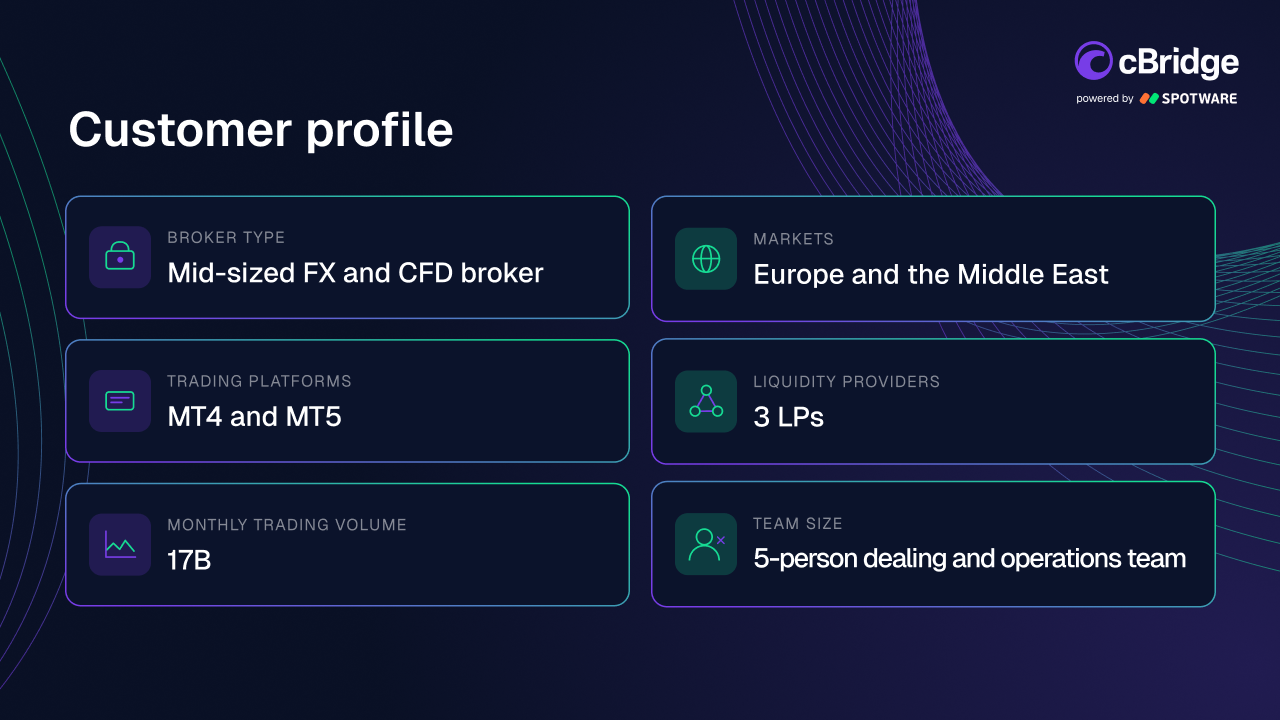
The client is a mid-sized FX and CFD broker that has asked not to be named.
The broker serves clients across Europe and the Middle East. It operates MT4 and MT5, connects to three liquidity providers and processes $17 billion in monthly trading volume. Its setup reflects the operational profile of a growing broker handling steadily increasing trading flow across two platforms.
Execution is managed by a five-person dealing and trading operations team. The broker had entered a more mature stage of growth, with rising client activity, increasingly complex routing requirements and plans to expand into new markets and asset classes.
The challenge
The previous bridge used volume-based pricing, with a fee charged per million traded. As the broker’s monthly trading volume reached $17 billion, its bridge costs increased in parallel. What began as a manageable expense rose as trading activity expanded across MT4 and MT5, reaching approximately $24,000 per month.
Fixed charges accounted for only a small share of the total cost. The volume fee accounted for most of the cost and increased solely with trading volume, although the underlying infrastructure remained unchanged.
“We had reached a point where trading more automatically meant paying significantly more for the bridge. That did not reflect any major change in our setup, so we started looking for a model that was more predictable as the business scaled.”
Chief Operating Officer, international FX and CFD broker
The solution
The cost saving was clear from the start. cBridge replaced volume-based pricing with fixed infrastructure pricing, so the broker’s bridge bill would no longer rise with trading activity.
The solution also matched the broker’s existing setup. It supported MT4 and MT5, connected to all three liquidity providers and included migration support from Spotware’s team. This meant the broker would not have to reconfigure LP sessions, symbol mappings, routing rules and markup logic alone.
Operationally, cBridge also provided a clearer interface for managing the setup. Routing, pricing and configuration logic could be viewed and managed in a more structured workspace, while built-in validation checked changes and flagged potential issues before they were saved.
Volume-based liquidity bridge pricing compared with cBridge fixed infrastructure pricing
Volume-based bridge | cBridge | |
|---|---|---|
Model | Per million traded | Fixed infrastructure pricing |
Paid at $17B | ~$24,000/month | ~$10,000/month |
Scales with volume | Yes | No |
Annual | ~$288,000 | ~$120,000 |
A 58% reduction: around $14,000 a month, over $168,000 a year. Because the cBridge figure is fixed while a volume-based bill keeps climbing, the saving increases as the broker’s trading volume grows.
The migration
The potential saving was clear, but the broker also needed confidence that moving its existing setup would not disrupt live trading.
Spotware supported the migration of the broker’s key configuration, including LP sessions, symbol mappings and routing logic. The configuration was tested in UAT, both bridges ran in parallel during the transition, and the trading flow was moved gradually.
The broker completed the switch within a few weeks, with no trading downtime and without rebuilding the configuration from scratch.
The results
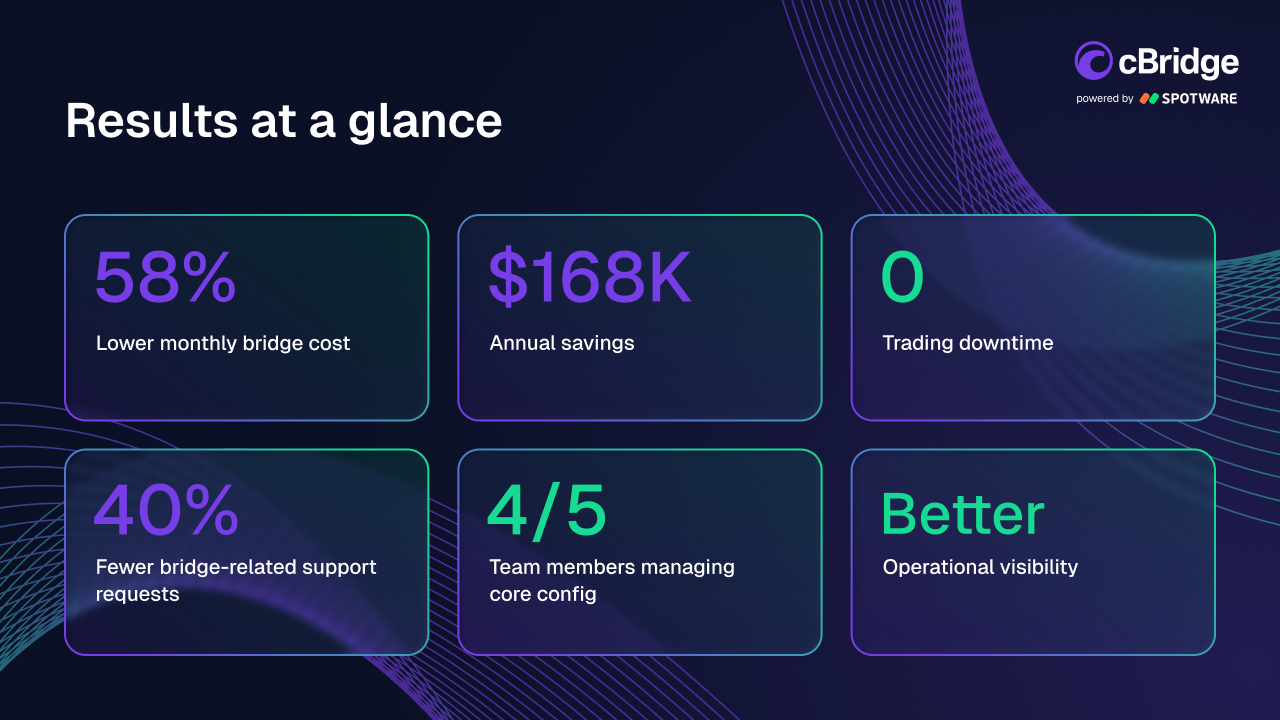 The most immediate result was a reduction in bridge costs. By moving from volume-based fees to fixed infrastructure pricing, the broker reduced its monthly bill from approximately $24,000 to $10,000.
This represented a saving of around $14,000 per month or approximately $168,000 per year. As the broker’s trading volume continues to grow, its bridge costs no longer increase automatically with every additional million traded.
The change also improved day-to-day operations. Bridge-related support requests fell by around 40%.
Knowledge of the bridge configuration also became less concentrated. Before cBridge, only two members of the five-person dealing and operations team could confidently manage the core setup. After implementation, four team members were able to understand and manage it.
This reduced key-person dependency, made everyday configuration changes faster and gave the wider team greater visibility into routing, pricing and bridge operations.
The transition was completed without trading downtime, allowing the broker to achieve the cost and operational benefits without disrupting live client activity.
“I spent a long time considering the move, especially knowing that we would become the first public cBridge case study. I wanted to be certain that the results would stand up in practice, not just look good on paper. In the end, the cost reduction was significant, but what convinced me was how much easier the bridge became for the wider team to understand and manage.”
Chief Operating Officer, international FX and CFD broker
Conclusion
The common pricing model charges per million traded, so the cost rises with client activity rather than with the infrastructure running the bridge. cBridge prices the infrastructure instead and supports the migration, so switching is no longer the obstacle that keeps brokers paying more than they need to.
For this broker, that meant ~$10,000 a month instead of $24,000, a simpler operation, no downtime during the migration and around $168,000 a year kept within the business.
If your bridge bill has increased with trading volume, it may be worth reviewing the numbers based on your own setup.
See how much your brokerage could save with fixed infrastructure pricing.